기본 matplotlib 이용하여 데이타 출력
# -*- coding: utf-8 -*-
%matplotlib inline

import pandas as pd
from pandas  import Series, DataFrame
import matplotlib
import numpy as np
import matplotlib.pyplot as plt

# 한글 폰트 깨짐 방지
krfont = {'family': 'nanumgothic', 'weight': 'bold', 'size': 10}
matplotlib.rc('font', **krfont)

df=pd.read_csv('open-api.csv', sep=',')
df.groupby(by='category').count()['read'].plot(figsize=(15,5), kind='bar')
bokeh를 이용한 데이타 출력
from bokeh.plotting import figure, show
from bokeh.io import push_notebook, show, output_notebook
from bokeh.charts import Bar, Line
output_notebook()
tooltips=[
('read', '@y')
]
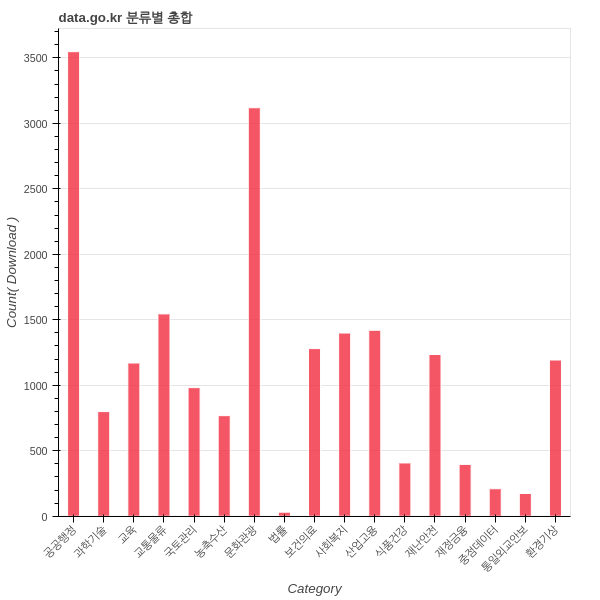
box_plot = Bar(df, label=['category'],
values='download',
bar_width=0.4,
agg='count',
title='data.go.kr 분류별 총합',
tooltips=tooltips,
legend=False)
show(box_plot)
handle yahoo data
from pandas_datareader import data as web, wb

from bokeh.charts import Line
plot = figure(width=500, height=150)
plot.line(price)
show(plot)
https://github.com/wesm/pydata-book